
You know the saying: knowledge is power.
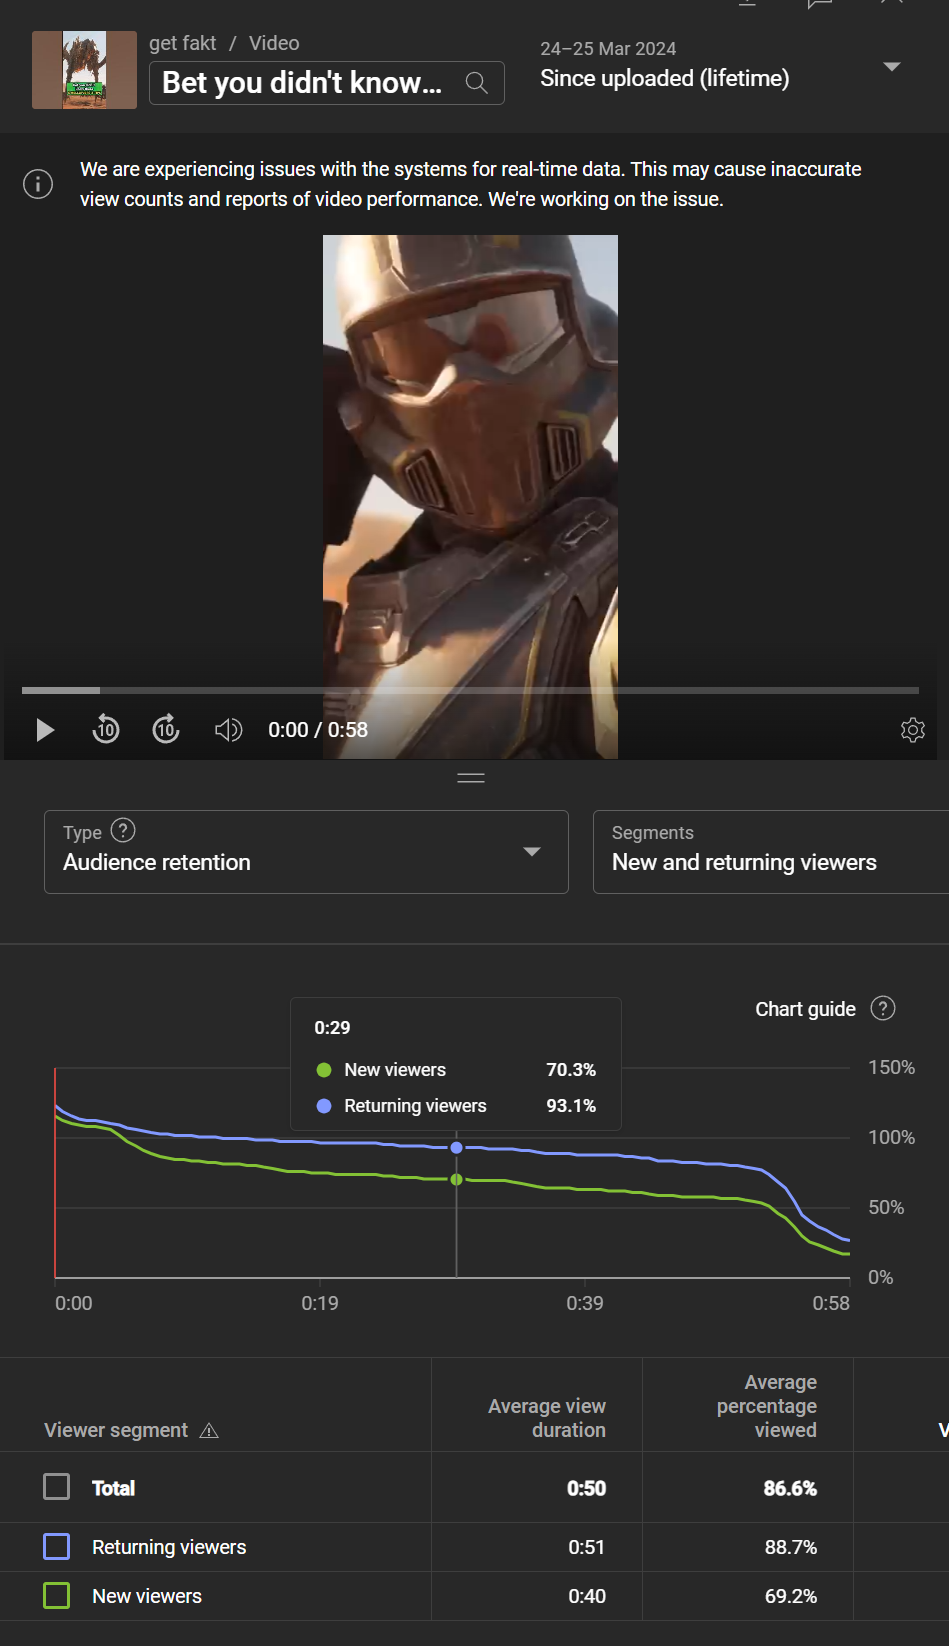
I have a video that has an average percentage viewed of over 86%.
This means the 58-second Short gets watched on average 50 seconds. (The last 8 seconds are the call to action, asking people to comment. It’s expected that audiences swipe away at that point.)
That’s excellent retention – or is it?
Understanding more about your audience is one of the most important paths to growth
86% is a great retention number, and Average Percentage Viewed is an extremely important retention metric to track.
But what’s more important is knowing who had that retention.
Average Percentage Viewed is an average, right? That means some people watched more than 86%, and some watched less.
The question is: who?
We now can see the retentions of different audience types
If new viewers are watching longer than returning viewers, what does it say about your content and what can change?
What if returning viewers are watching more than new viewers?
With that knowledge, you can adjust your content to target growth and new audiences or sustain current audiences.
Do this right now
- Go to YouTube Studio and go into the analytics section for any video.
- On the Overview tab, scroll down to the Retention graph and click “See more.”
- Use the dropdown on the right to select one of the three different audience types: subscribers and non-subscribers, new and returning viewers, and organic and paid traffic
- See if there are any big differences, especially big dips or spikes.
- Understand what that means and then adjust your content accordingly, if needed.
The audience retention breakdown looks like this.
See that difference? See that dip?